ENIAC, and the first machine forecast
In 1950 a machine reproduced in about a day the kind of calculation Richardson had done by hand in six weeks, and the result was good enough to prove the method rather than the weather.
The first time a computer predicted the weather, the forecast was already history — but that was the point.
A problem waiting for a machine
Lewis Fry Richardson had shown in 1922 that atmospheric dynamics could in principle be solved numerically: write down the governing equations, discretise the atmosphere into a grid, and grind through the arithmetic. His answer was famously wrong, not because the method was broken but because the initial data fed into it was too noisy, amplifying pressure tendencies until they became nonsense. The physics was sound. What was missing was a machine fast enough to make the method practical, and a mathematician sharp enough to fix the initialisation.
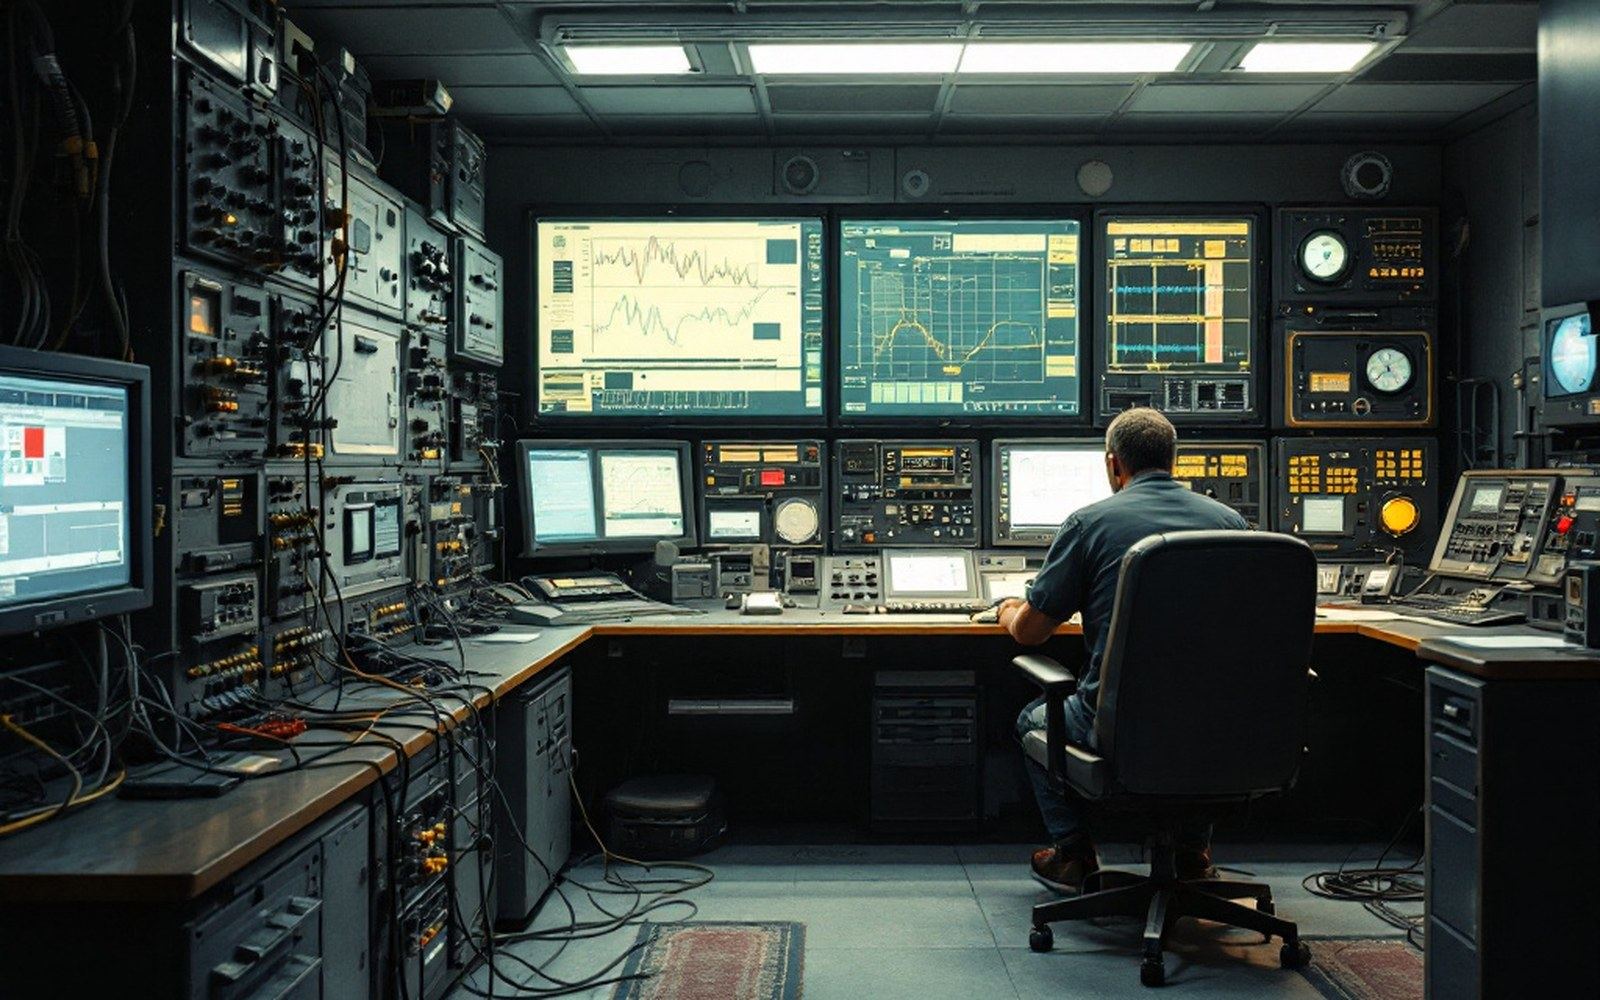
By the late 1940s the machine existed. ENIAC — the Electronic Numerical Integrator and Computer, built at the University of Pennsylvania and completed in 1945 — had been designed for ballistics tables. It occupied a large room, consumed roughly 150 kilowatts, and could perform a few hundred multiplications per second: not fast by any later standard, but orders of magnitude beyond a roomful of human calculators. The question was whether weather prediction could be turned into the kind of structured numerical problem the machine could actually handle.
The person who turned it was Jule Charney ↗. Working first at the Institute for Advanced Study in Princeton and later at the Massachusetts Institute of Technology, Charney identified the key simplification Richardson had lacked: filter out the high-frequency sound waves and gravity waves that had swamped Richardson's initial solution, and work instead with a reduced set of equations describing only the large-scale flow. The specific formulation he used is called the barotropic vorticity equation, and it describes how a single layer of the atmosphere, treated as a thin fluid on a rotating sphere, evolves over time. One layer, one equation, and the noise problem largely disappears.

The runs of April 1950
In the spring of 1950, Charney assembled a team that included the meteorologists George W. Platzman and Ragnar Fjørtoft, and they travelled to Aberdeen, Maryland, where ENIAC was then located, to run the experiment. They chose historical data — synoptic maps from four separate periods in 1949 — as the initial conditions. The forecasts they produced were therefore verifiable on arrival: the real weather for each period was already in the archives, which was precisely the point. This was not operational prediction; it was proof of concept, and the standard of proof was whether the computed 24-hour pressure patterns bore any meaningful resemblance to what had actually happened.
Did the computed forecasts bear a meaningful resemblance to the weather that had actually followed?
They did. The paper Charney, Fjørtoft and von Neumann published in Tellus in 1950 ↗ reported that the barotropic model captured the broad movement of large troughs and ridges well enough to be scientifically credible. The forecasts were not precise; they smoothed out detail and sometimes misjudged the amplitude of features. But they moved the right systems in roughly the right directions, and that was enough. The question Richardson had posed — whether atmospheric physics could be computed — had an answer that was no longer hypothetical.
The 1950 experiment, step by step
- Initial conditionsfour historical synoptic periods from 1949, chosen because the real outcomes were already known
- SimplificationCharney's barotropic vorticity equation, one atmospheric layer, sound waves and gravity waves filtered out
- MachineENIAC, Aberdeen, Maryland; roughly 24 hours of machine time per forecast period, spread over several actual working days
- Output24-hour pressure-pattern forecasts; large-scale trough and ridge movement broadly captured
- PublicationCharney, Fjørtoft and von Neumann, Tellus, 1950
The computation itself took roughly 24 hours of machine time spread across several days of actual work, because ENIAC required constant attention: setting plugboards, checking for valve failures, restarting after errors. A forecast that covered a 24-hour atmospheric period took about a day of computing effort for one level of the atmosphere. Richardson's six-week hand calculation had produced a six-hour forecast. The ratio had improved by something like two orders of magnitude, but operational real-time prediction was still some years away.
What the machine actually proved
John von Neumann, who had pushed meteorology as a target application for ENIAC partly because it offered a problem with clear societal value and partly because it was computationally hard enough to test the machine's limits, understood that the 1950 runs were an existence proof rather than a working forecast service. The atmosphere is a continuously evolving system; feeding it historical data removes the pressure of real-time observation and data assimilation. What the experiment demonstrated was that numerical methods, given adequate initial data and a physically sensible simplification of the equations, would not simply explode into nonsense the way Richardson's had. The model was stable. That was not a trivial result.
The practical implications followed within the decade. The Joint Numerical Weather Prediction Unit, a collaborative venture among the United States Weather Bureau, the Air Force and the Navy, began operational numerical forecasts in 1955. By the early 1960s, numerical guidance was reaching forecasters routinely. Centres that would become central to the field — the European Centre for Medium-Range Weather Forecasts ↗ in Reading, England, established in 1975, and NOAA's Environmental Modeling Center — trace their intellectual lineage directly to the 1950 Princeton work.
Who was in the room
- Jule Charneylead mathematician; developed the barotropic simplification that made stable computation possible
- Ragnar FjørtoftNorwegian meteorologist; co-author of the 1950 paper
- George W. Platzmanmathematician; part of the Princeton team for the Aberdeen runs
- John von Neumannchampioned meteorology as a target application for ENIAC; Institute for Advanced Study, Princeton
The barotropic model was always an interim tool. It treated the atmosphere as a single layer and ignored temperature gradients, moisture, and the vertical structure that baroclinic instability — the mechanism driving most midlatitude storms — depends on. Charney himself moved on to multi-level baroclinic models within a few years, and the progression toward three-dimensional, high-resolution global models was underway before the decade closed. But the 1950 runs established the template: physics expressed as equations, equations expressed as finite differences on a grid, differences computed step by step forward in time. Every numerical weather prediction model run today by the Met Office, by ECMWF, or by NOAA follows that same architecture.
What came next
- 1955Joint Numerical Weather Prediction Unit begins operational numerical forecasts in the United States
- 1975ECMWF established in Reading, England
- Multi-level baroclinic modelsCharney's own next step, capturing vertical atmospheric structure Richardson's approach required but had no machine to run
Richardson had imagined a forecast factory — sixty-four thousand people doing arithmetic in a tiered hall, keeping pace with the atmosphere in real time. He knew such a factory would never be built, and wrote his vision partly as a reductio ad absurdum of how hard the problem really was. ENIAC was not that factory; it was far slower, far less accurate, and it operated on data that was already stale. But it was the first machine that made the factory seem, eventually, possible. The weather being forecast had already passed. What ENIAC produced, in a room full of plugboards and hot valves, was not a forecast so much as a demonstration that forecasting could one day be a machine's job — and a signal to every meteorologist in the room that the era of the human calculator was ending.
Elsewhere in The room
Richardson's hall is now a room of screens. Everything in this sectionis about what happens after ENIAC: how the work Richardson imagined is actually done today.
- How a model is actually runLongRunning a numerical weather model is not pressing a button and waiting.
- Somebody still draws the isobarsMediumThe synoptic chart looks like it predates the computer.
- The People on ShiftMediumA forecast office runs continuously, and the handover between shifts is where judgement is actually transferred from one person to the next.
- Getting the observations inMediumBefore the model can run, it needs to know where the atmosphere is right now — and that is harder than it sounds.